Independent educational guide. All numerical examples are hypothetical; this is not a trading signal or investment advice.
A profitable-looking backtest is easy to make by accident. Try enough indicators, time windows and stop distances on the same EUR/USD history and eventually one combination will look extraordinary. It may even survive a second run—on exactly the same candles. The problem begins when the strategy encounters prices that were not available during development. The market does not owe an algorithm the patterns it found in the past.
Artificial intelligence has made strategy research faster, but it has also made testing mistakes easier to scale. This guide explains how to check three common failures—look-ahead bias, overfitting and unrealistic execution—and build a test that is worth reviewing. No live account or verified profitability study accompanies this article. The numerical results are examples designed to make the calculations understandable, not historical outcomes.
A backtest is an experiment, not a forecast
A backtest applies predetermined trading instructions to historical information. A useful test asks whether a defined process would have behaved acceptably after costs and under the trading conditions represented by that information. It cannot prove that a future market will provide the same opportunities. When the rules are continually changed until the test looks profitable, the test becomes part of the design process, not independent evidence that the design works.
A simple question reveals the difference: could another researcher reproduce the results with the same data, session clock, instruments, order rules and assumptions about fees? If not, the equity curve is mostly decoration. Preserve the data source, code version, changes to the model and date of each test. This matters equally for a machine-learning model and an old-fashioned moving-average strategy.
Look-ahead bias: using tomorrow’s information today
Suppose your algorithm buys EUR/USD at 10:00 after observing that the 10:00–11:00 hourly candle will close above resistance. At 10:00, that candle has not closed. The instruction is impossible unless the system is looking at an incomplete bar while treating it as final, or at a dataset indexed incorrectly. A backtest may show surprisingly accurate entries because it has learned from information that did not yet exist.
Revised economic statistics cause a similar problem. An inflation observation may be labeled with the month it describes, even though the release occurred weeks later. If the model receives the revised number on the month’s final trading day, it benefits from future information. QuantConnect’s research documentation calls this look-ahead bias; the practical cure is to store a separate availability timestamp and use only information available before each decision.
Why random splitting can make a forex AI model look better
Many standard machine-learning tutorials randomly split rows into training and testing datasets. For time-ordered financial observations, this can mix future conditions into the model’s development process, especially where neighbouring features share price history. Training on later market periods and evaluating on earlier ones does not recreate the decisions a trader could have made. Even when leakage is indirect, it may inflate predictive accuracy.
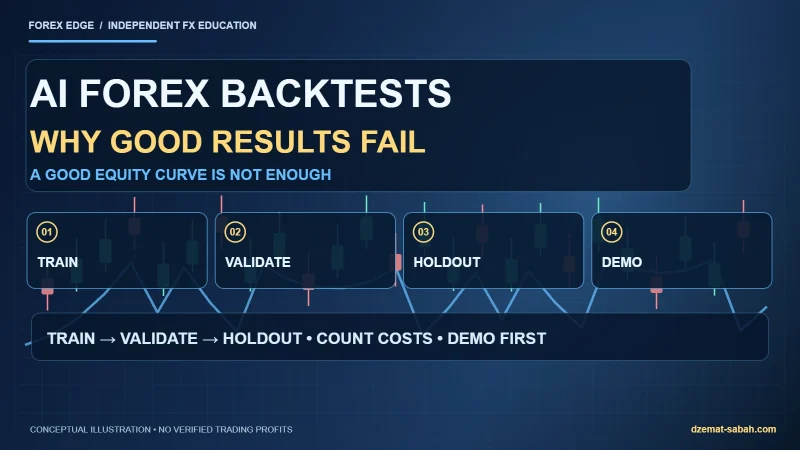
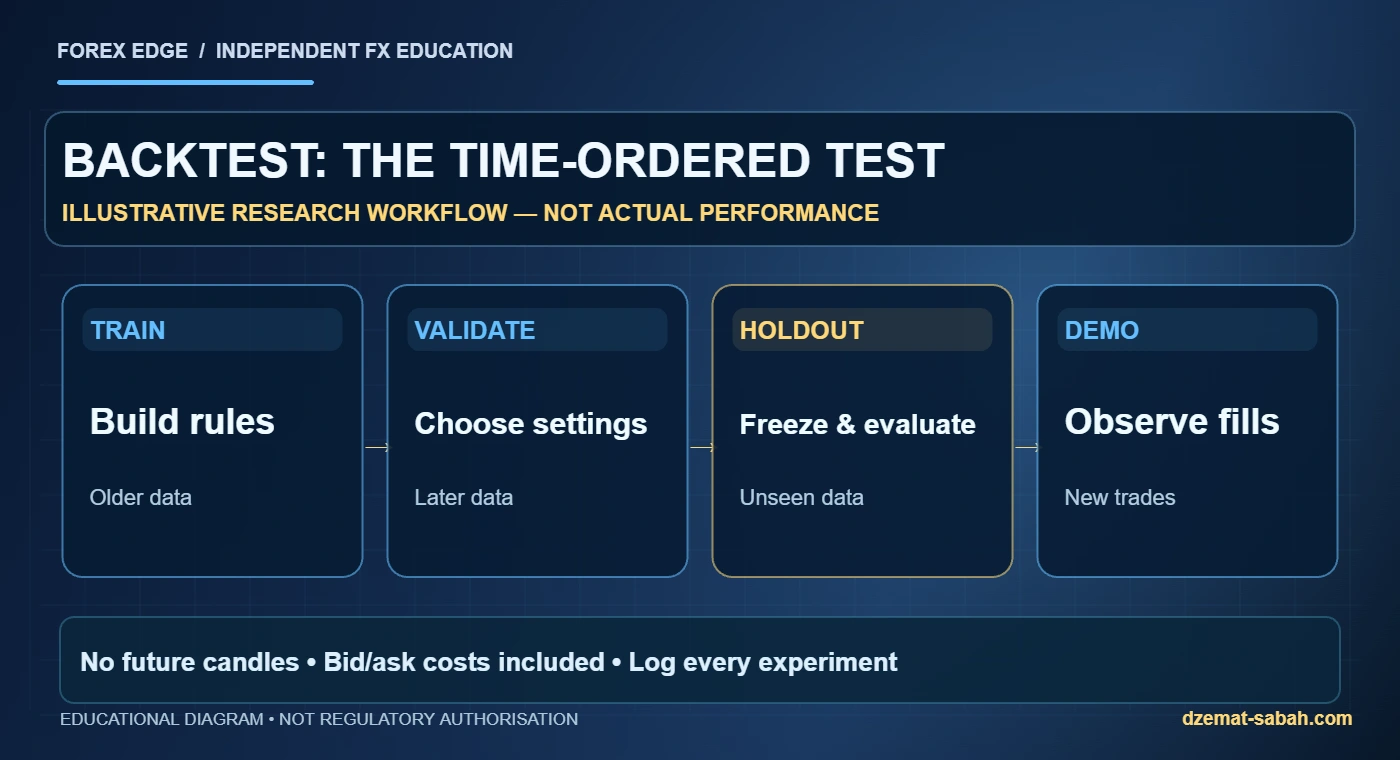
Instead, separate observations chronologically. For example, train a model on hypothetical data from 2019–2022, use 2023 for validation decisions and keep 2024–2025 untouched as the final holdout. These dates are only an illustration. The actual windows should be chosen before examining results, and overlapping feature or label horizons may require a gap around the split. If you tune again after seeing the holdout results, that holdout becomes part of development and is no longer an independent test.
Overfitting: when a strategy learns the noise
Imagine testing moving-average windows of 11, 12, 13, all the way to 100, with different RSI thresholds, stops and take-profit ratios. Hundreds of combinations become thousands of possible outcomes, making a remarkable historical result unsurprising even without a genuine edge. The winning parameter may describe nothing more than a chance relationship in the selected sample.
A practical robustness check changes a parameter slightly, adds realistic slippage, shifts the entry time by one bar or tests another market period. A method that only works at exactly 17 candles but collapses at 16 and 18 deserves skepticism. Restrict the number of tests, document which combinations you tried, and compare the final strategy with a much simpler baseline. QuantConnect’s research guidance explicitly warns against data mining and repeated selection of the best backtest.
Walk-forward testing in plain language
Walk-forward testing repeats the sequence of learning from an earlier period and evaluating on a later period. A researcher might fit rules using twelve months, then evaluate them over the next three months, roll the window forward and repeat. The important distinction is that the settings chosen for each test window must come only from information that preceded that window. All test outcomes, including weak ones, belong in the summary.
| Step | Example window | What is permitted? |
|---|---|---|
| Fit | Months 1–12 | Select rules using past observations |
| Test | Months 13–15 | Keep fitted rules unchanged |
| Roll | Months 4–15 | Refit using data now available |
| Test again | Months 16–18 | Evaluate without seeing future bars |
This table is a methodological illustration, not a timetable that suits every market. Look at all windows, not just the best one. A few very profitable months can hide a much longer period of poor execution or a deep drawdown. If you keep changing window lengths after observing which arrangement wins, you are introducing a new round of optimisation.
A worked example of execution costs changing the answer
Take a fictional test of 120 trades. Assume that total gross gains and losses produce +18R after exits are calculated at ideal chart prices. If the combined cost of spread, commission and realistic slippage averages 0.20R per trade, the test pays 24R in costs and ends at −6R. There is no investment return being reported here; the example shows why a profitable line calculated using midpoint prices can fail when bids, asks and execution are considered.
Cost assumptions must be matched to instrument, broker and time. EUR/USD during normal liquid hours may trade with a different spread from the same pair around rollover or a major news announcement. Orders can fill worse than the requested price or fail to fill. Stop-loss orders help manage risk but cannot guarantee that the exit occurs exactly at the level specified.
What metrics deserve a place beside win rate?
Win rate says how often a trade was recorded as positive, but not how much winners gained or losers lost. Track net expectancy in R, average win and loss, maximum equity drawdown, longest losing run, number of trades, turnover, trading costs and market exposure. Separate results by market session and by event conditions where you have enough observations to make such a division meaningful.
Be clear about the difference between a balance curve, which may ignore floating losses, and an equity curve. If a strategy can keep losing positions open indefinitely while reporting small closed gains, balance-based performance can look smooth while financial exposure grows. Also check the maximum simultaneous risk from related currency pairs; several nominally different trades can depend on the same USD scenario.
How ChatGPT can contribute without certifying the result
An AI assistant is useful as a demanding reviewer. Give it your written strategy rules, column definitions and a redacted sample of the log, then ask: ‘Which rows use information published after the proposed entry? Have I mixed training and test periods? Are spreads, financing and slippage applied consistently? Which parts of the strategy cannot be reproduced from the information shown?’ Require it to mark assumptions explicitly and never to invent missing prices.
Check each answer against the original data and calculation engine. AI-generated code should be tested for column errors, timezone conversions, missing values and position-size mistakes. Our AI Forex trading pillar explains the overall workflow, and the London breakout case study applies these ideas to one hypothetical trading plan.
A good final test can end with ‘do not trade’
Once a strategy passes a strictly separated historical evaluation, a demo account can expose mismatches between the model and the real trading platform. Compare logged decisions with actual bids and asks, margin rules, rejections, timezones and fills. Avoid editing parameters after every losing demo trade; that simply extends the optimisation process into the new sample without clearly measuring stability.
The result of honest research may be that a strategy has no demonstrated advantage after costs. That outcome saves capital and is useful knowledge. Before any real-money decision, review the backtesting methodology guide, risk budgeting and the limits of automated forex robots. There is no shortcut from a good-looking simulation to guaranteed profit.
Frequently asked questions
What is look-ahead bias in a forex backtest?
It occurs when a simulated decision uses information that would not have been available at that moment, such as a candle’s future closing price or a later revised economic figure.
Does walk-forward testing prove an AI strategy will profit?
No. It can expose fragile rules and reduce certain testing errors, but changing market conditions and real execution still create risk.
Why isn’t a high win rate enough?
Because average losses, fees, holding costs and drawdowns can outweigh frequent small wins.
Can ChatGPT run a verified market backtest on its own?
Only when given appropriate data, tools, code and clear assumptions; the outputs still need independent checks and do not certify future returns.
Primary sources and further reading
- QuantConnect — Hypothesis-driven research, look-ahead bias and overfitting
- QuantConnect — Optimization parameters and walk-forward warnings
- QuantConnect — Reality modeling for fees and fills
- CFTC — Retail forex trading risk disclosure
Markets, execution conditions and financial permissions may change. Review the underlying source and your actual contract before acting. Read our risk disclosure and editorial policy.
About the Author