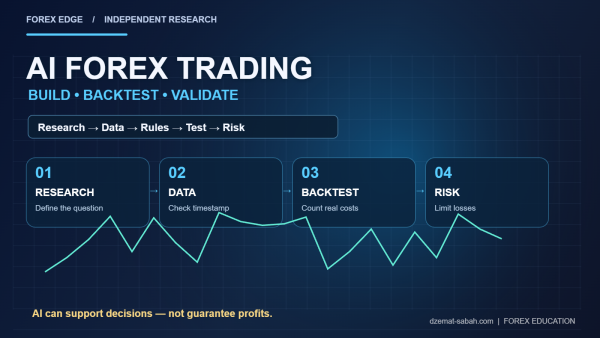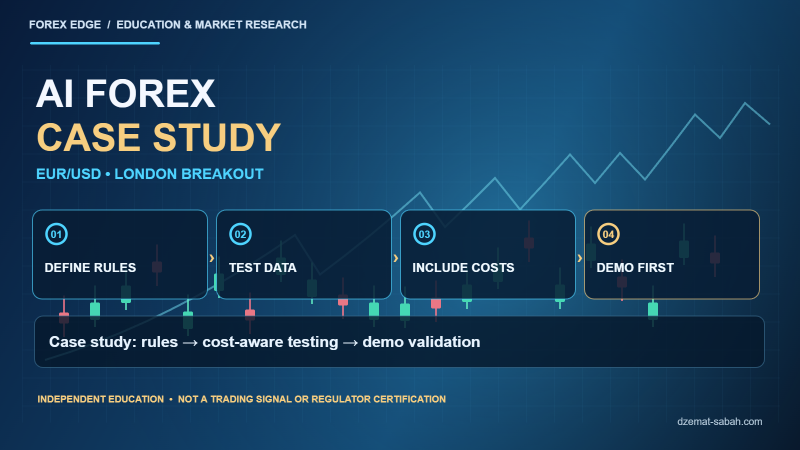
Independent educational analysis. Illustrations are hypothetical, not investment advice or verified trading results.
The phrase “build an AI forex strategy” sounds exciting, but the real challenge is not writing a prompt. It is designing a repeatable test that does not use tomorrow’s information, includes the cost of trading, and survives market conditions it has not seen. This case study starts with one modest hypothesis about the London forex session and demonstrates how an AI assistant can help document and challenge it. It does not claim to have discovered a profitable signal.
Everything in the worked example is hypothetical. There is no live brokerage account, proprietary price dataset, or audited performance curve behind the numbers below. A reader who wants to implement the idea should use licensed data, a verified calendar, realistic execution assumptions and a demo account before considering any financial commitment.
The question: does a London breakout offer a testable pattern?
During the quiet hours before European financial desks become active, EUR/USD sometimes trades within a compact range. Traders often discuss a breakout when price crosses that range near the London opening. However, a visible chart pattern is not proof of a positive expected return. The hypothesis to investigate is narrower: after accounting for spread, commission and failed breaks, does a precisely defined breakout procedure perform differently from a simple baseline?
To compare outcomes fairly, choose a fixed definition for the earlier range, the session timezone and the execution rules. Do not move the range edges after seeing which candles won. The opening hour will also shift against UTC during British Summer Time, so a backtest that treats London as UTC+0 all year risks comparing different market periods.
Define every part of the rule before testing
One example specification could measure the high and low of a pre-London window fixed in UTC. The candidate signal requires a completed 15-minute candle to close beyond that range, followed by a retest within three subsequent candles. The trade is cancelled when the planned stop distance exceeds an allowed threshold, the spread exceeds a defined limit or a scheduled high-impact release falls inside the rule’s exclusion window. All of those thresholds must be chosen in the research specification, not selected afterward from the best trades.
The invalidation point must relate to market structure rather than a desired profit target. A stop placed just beyond a retest low for a long idea, combined with an exit plan defined in R multiples, creates a rule a programmer can represent and a human can audit. If the market never offers the stated setup, record a missed opportunity as no trade rather than adding an improvised entry.
Ask AI to challenge the rules, not to invent a signal
Give the assistant the exact rule sheet and ask it to find ambiguity. A useful prompt is: “Review this EUR/USD London breakout test. Identify every place where a programmer could accidentally use future candle data, where daylight-saving time changes the session, and where trading costs or missing quotes could distort results. List the fields needed in a journal. Do not predict future prices or fabricate a performance result.”
This transforms AI from a signal salesman into a research reviewer. You still have to check the output against the code and data. A model may sound certain when it misunderstands the broker’s contract specification, the minute at which a report was published, or whether a candle has completed.
Make a historical dataset that was available at the time
Use timestamped market quotes with an identified timezone and, if possible, historical bid and ask instead of a single mid-price. Clean duplicates and gaps; keep records of missing or invalid periods. Economic releases must be associated with their publication timestamp, not just the reference month. If you test a rule using a candle’s final high before that candle ends, the backtest has already gained information a real trader did not have.
Divide the observations chronologically into development, validation and final holdout periods. Only the development section should guide most rule decisions. Keep the final holdout unused until the model is frozen, and document each change that results from intermediate testing. For an automated model, walk-forward testing can retrain on older data and evaluate on a later window, repeating that procedure without looking into the future.
Worked mathematics: positive gross return can become a net loss
Imagine 80 hypothetical demo signals with 38 gross winners averaging +1.4R and 42 gross losers averaging −1R. The gross total is 38 × 1.4 minus 42 = +11.2R. If the full round-trip cost for each signal averages 0.18R after spread, commission and slippage, then total costs are 80 × 0.18 = 14.4R. Net result: −3.2R. No actual trading evidence supports these invented figures; they are a cautionary arithmetic exercise.
| Measurement | Illustrative figure |
|---|---|
| Signals | 80 |
| 38 × +1.4R | +53.2R |
| 42 × −1R | −42.0R |
| Gross result | +11.2R |
| Execution costs, 80 × 0.18R | −14.4R |
| Net result | −3.2R |
A cost-aware model should use the same definition of R on winners and losers, include the effect of partial fills, and model a worse spread during news or low-liquidity periods. If a strategy’s apparent edge disappears with a small increase in costs, it is not robust enough to be marketed as a reliable source of income.
Position sizing and correlation still matter
Suppose a hypothetical USD-denominated demo account has equity of $1,200 and an illustrative per-trade risk allowance of 0.5%, or $6. With a stop 20 pips away on EUR/USD and an approximate $10 per pip per standard lot, the theoretical size is $6 divided by $200, or 0.03 standard lot. That calculation ignores commission, gaps and changing broker specifications; validate the actual pip value in your trading platform and round conservatively to allowed increments.
Do not open three correlated USD-sensitive positions simply because the AI produces three separate buy alerts. A portfolio-level risk check should aggregate possible losses and consider whether a single interest-rate surprise could affect them together. A stop-loss order is a risk-control instruction, not an absolute loss guarantee.
How to evaluate results without fooling yourself
Useful measurements include net expectancy, profit factor, win and loss distributions, maximum drawdown, exposure, turnover and results grouped by month, session and market condition. Check whether performance changes drastically when a lookback period moves by one bar or a stop distance changes slightly. A model that only works for one exact parameter may be overfitted to a historical accident.
Compare the result with simple benchmarks: no trade, a transparent fixed-rule system, or another method with the same exposure and turnover. Run the final test on unseen dates once, then treat further tuning as a new experiment rather than reusing the same holdout indefinitely.
Move to demo only after a reproducible test
Before any real-money activity, verify that the program reads the same timestamps and prices as the platform and that it respects maximum size, spread ceilings, order rejection rules, network interruptions and broker outages. A demo account can reveal practical issues such as different server clocks or assumptions about a symbol’s contract size, but demo fills are not guaranteed to represent live execution.
Store the rule version, dataset hash, test run and results so another reviewer can reproduce the study. The AI Forex pillar lays out the larger workflow, while our London market session guide and backtesting guide provide background. If independent tests show no advantage after costs, the correct result is to reject the strategy, not to force trades until the chart looks profitable.
Frequently asked questions
Did this case study produce real forex profits?
No. This article provides a hypothesis and worked mathematical examples only. It does not include a validated dataset, broker statements or independently audited live performance.
Can ChatGPT calculate a profitable entry automatically?
A language model can help formalise rules, but it cannot guarantee or verify a profitable entry without reliable data, rigorous testing and actual execution evidence.
Why test a London breakout on unseen data?
Rules developed on one historical period may fit its noise. Chronological holdout and demo observations help identify fragile results, although they cannot guarantee future performance.
Official sources and further reading
- CFTC — AI trading-bot fraud warning
- QuantConnect — Research Guide
- QuantConnect — Reality Modeling
- UK government — Daylight saving clock changes
- CFTC — Retail forex advisory
Notice: Trading carries significant risk. Check current broker contracts, regulatory activity, data timestamps and all execution assumptions. Read the risk disclosure and editorial policy.
About the Author