A familiar high or low can attract plenty of attention on a forex chart. The interesting part often comes after price crosses it: does the market hold beyond the level, or does the candle close back inside?
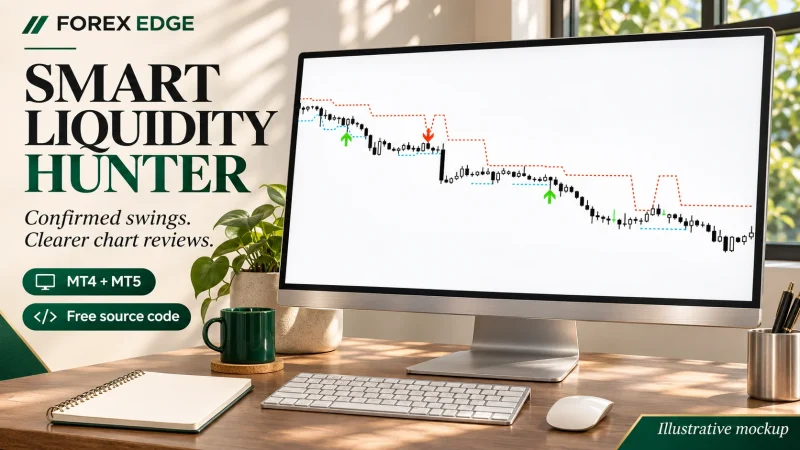
Smart Liquidity Hunter gives that question a repeatable set of rules. Available for MetaTrader 4 and MetaTrader 5, it marks qualifying sweeps of confirmed swings, with reference levels that help explain each setup. Its appeal is straightforward: less manual searching, more consistent chart review, and source code you can inspect.
The Smart Liquidity Hunter guide on ForexSignal24 brings together the downloads, settings and platform examples. Here, we look at where the tool fits into a trader’s routine and which details deserve attention before using its signals.
Review scope: this article examines the published v1.11 documentation and source rules. It does not report a live-trading performance test.
What Smart Liquidity Hunter actually does
The indicator looks for price moving through a previously confirmed swing, then rejecting that area within a completed candle. A qualifying move beneath a swing low receives a bullish marker; a qualifying move above a swing high receives a bearish marker.
“Liquidity” needs some context here. The calculation uses open, high, low and close prices. Swing levels serve as possible areas of interest; the indicator cannot see resting orders or other traders’ stop losses. Our guide to reading forex market liquidity provides background on why traders watch these areas.
Smart Liquidity Hunter is a chart indicator with defined filters. It is not an AI forecasting service or an Expert Advisor, and it does not open, manage or close positions. It evaluates the symbol and timeframe of the chart to which it is attached.
How the signal rules work
A swing must be confirmed first
At the default SwingStrength of 3, a pivot requires three candles on each side. Crucially, the newer confirmation candles must have closed before the potential signal candle begins. That prevents a setup from borrowing a swing that only becomes clear later.
The indicator searches for the nearest eligible swing within its age limit. With the default freshness filter enabled, a level is excluded when an intervening candle has already pierced it. An exact touch alone does not automatically invalidate the reference.
The sweep must clear a minimum distance
A small move through a level is not enough. Price must move strictly beyond the larger of two thresholds: a fixed distance in symbol points, or a distance based on recent volatility.
Required sweep = max(12 symbol points, 0.10 × preceding mean true range)
Those are the default values. The volatility component uses a simple average of the previous 14 candles’ true ranges, excluding the signal candle. It is not Wilder’s smoothed ATR. Using the larger threshold gives the rule both a fixed minimum and an adjustment for recent price movement; it does not prove that the resulting signals are profitable.
The candle must reject the level
For a bullish setup, price sweeps below the eligible low, then closes above that reference. The lower wick must occupy at least 25% of the candle’s full range, and the close must finish in the upper 40%.
A bearish setup reverses those conditions: price sweeps above the eligible high, closes below it, leaves an upper wick of at least 25%, and finishes in the lower 40% of its range.
Candle color is optional and disabled as a filter by default. A bullish marker therefore does not necessarily sit beneath an up-close candle. If a candle qualifies in both directions, the indicator skips it.
The candle must be closed
The unfinished candle never receives a signal arrow. A new marker is evaluated after the candle closes and the terminal processes the new-bar update. This makes the close part of the setup itself, rather than something to assume while a wick is still forming.
Features and settings worth knowing
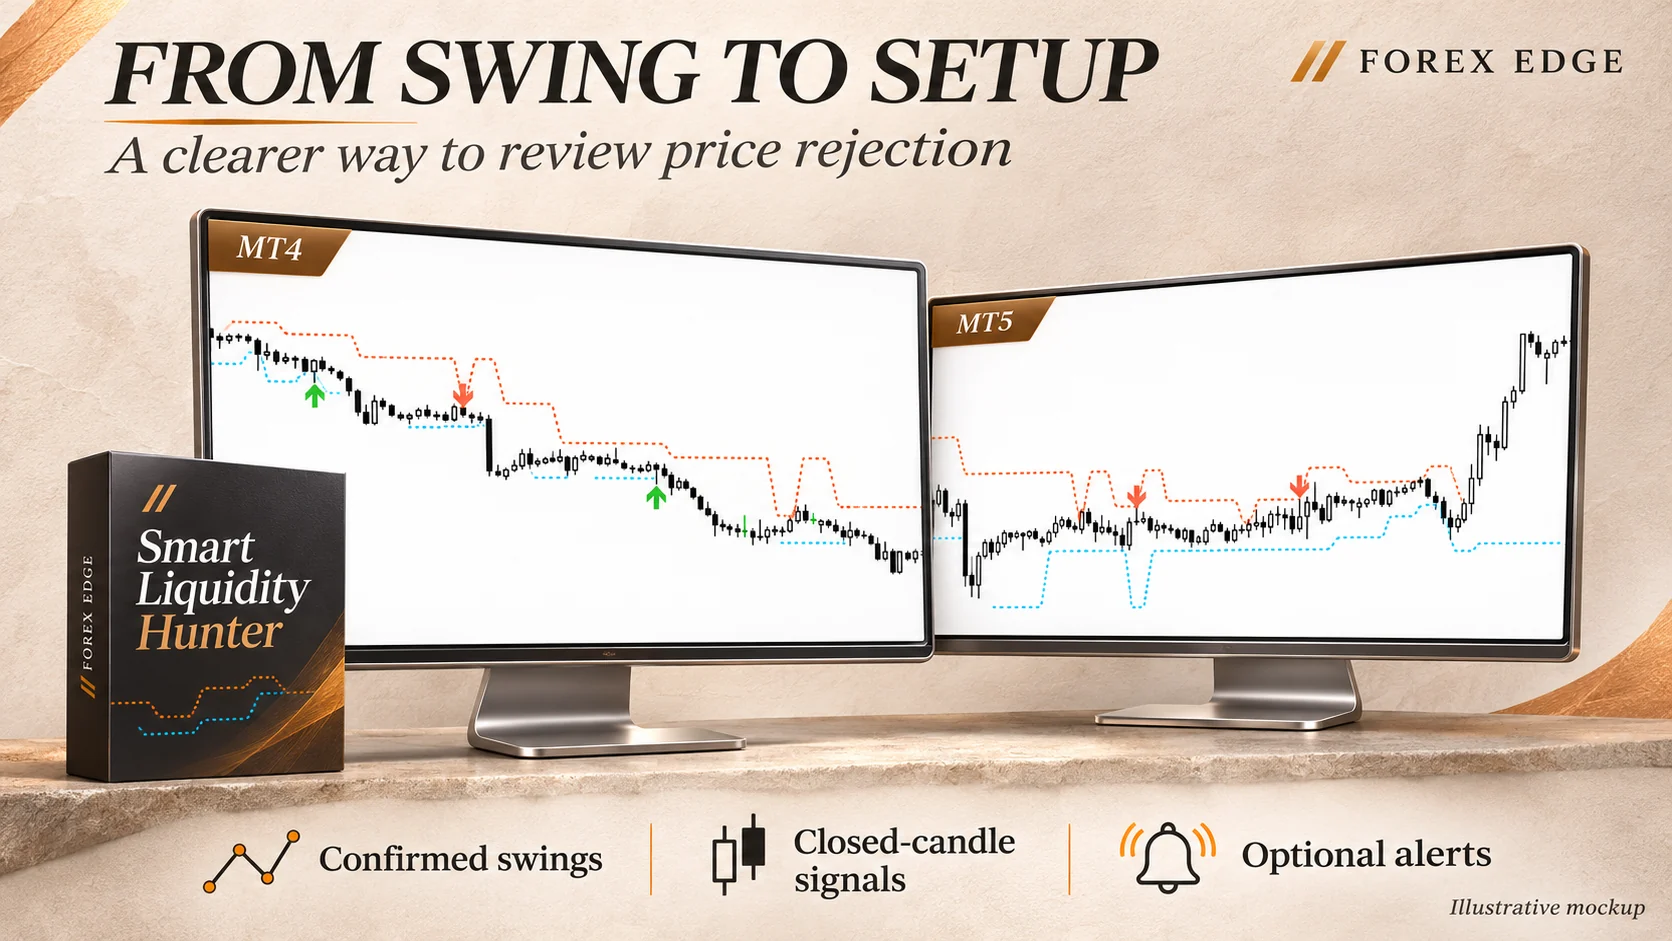
The display stays close to the chart. Green arrows appear below qualifying bullish candles, while red arrows appear above bearish ones. Dotted orange-red lines identify eligible high references; blue lines identify low references.
A dashboard shows the symbol, timeframe, reference prices and latest signal within the scanned history. That last detail matters when viewing an older example: the dashboard can refer to a more recent candle elsewhere in the loaded data.
| Setting | Default | Practical meaning |
|---|---|---|
SwingStrength |
3 | Three confirmation candles on each side of a pivot. |
MaxSwingAge |
100 bars | Limits how far back the reference pivot can sit. |
MaxBarsToScan |
1,000 bars | Caps the closed historical candles reviewed. |
MinSweepPoints |
12 points | Fixed component of the required sweep distance. |
VolatilityPeriod |
14 bars | Lookback for the preceding mean true range. |
MinSweepVolRatio |
0.10 | Multiplier for the volatility component. |
MinWickPercent |
25% | Minimum rejection wick relative to candle range. |
MinCloseLocationPct |
60% | Bullish close in the upper 40%; bearish in the lower 40%. |
RequireFreshLevel |
true | Excludes references pierced before the candidate candle. |
RequireCandleColor |
false | Candle direction is not required unless enabled. |
There are also controls for the dashboard, reference lines, text color and positioning. Multiple copies on the same chart need distinct DashboardInstanceId values. Version 1.11 stabilizes dashboard labels across profile reloads; its documented signal rules are unchanged.
Popup, sound and push alerts are available, but all start disabled. Push notifications require configuration in the terminal. Alerts are designed for newly closed candles during normal updates, with duplicate notices suppressed. Attaching the indicator or loading a batch of historical candles does not generate a stream of old alerts.
A bullish sweep, with the numbers made clear
Consider a hypothetical five-decimal EUR/USD chart with an eligible swing low at 1.08500. Suppose the preceding mean true range is 0.00080. Ten percent of that is 0.00008, so the fixed 12-point distance, 0.00012, becomes the larger threshold.
The candle’s low must therefore fall below 1.08488. Merely reaching that price is insufficient because the penetration rule is strict.
Now imagine a candle that opens at 1.08525, trades between 1.08480 and 1.08560, then closes at 1.08545. It sweeps 20 points beneath the reference and closes back above it. Its lower wick is 56.25% of the range, and its close sits 81.25% of the way up from the low. Those values satisfy the default rejection filters, assuming the swing and freshness conditions are also met.
That explains why a marker could appear. It does not establish what the next candle will do. Also, 12 points commonly equals 1.2 pips on five-decimal EUR/USD; gold and other instruments can have different specifications.
Installing the correct MT4 or MT5 edition
Both editions are available as free source downloads in MQL5 Code Base. Choose the MT4 release for MetaTrader 4 or the MT5 release for MetaTrader 5. The source header declares the MIT License.
- Download the appropriate
.mq4or.mq5file. - In your desktop terminal, select File → Open Data Folder.
- Place the MT4 file in
MQL4/Indicators, or the MT5 file inMQL5/Indicators. - Open it in that terminal’s MetaEditor and select Compile, or press F7.
- Check that compilation finishes without errors, then refresh Navigator or restart the terminal.
- Attach the indicator to a chart, load sufficient history and begin with the defaults.
The inspected source is standalone and does not require external includes or DLL imports. Use the data folder belonging to the terminal you intend to trade or review; separate broker installations can have separate folders.
Where it fits into a practical trading routine
The tool is most useful when a trader already has a reason to study rejection around swing levels. It can make those observations easier to collect and compare. The next job is to decide which observations belong in a trade plan.
Start on a demo account with one symbol and timeframe. Record every qualifying setup in your chosen review period, including the ones you would skip. Note the trend, session, nearby structure, spread and any major news around the signal. If you simulate entries, include realistic transaction costs and define entry, invalidation and exit rules before judging results.
A bullish sweep in a strong decline can still fail. A bearish sweep may leave little room before nearby support. Reading the context around the arrow is where discretion enters the process.
Keep the inputs unchanged while collecting your initial observations. Then adjust one setting at a time and evaluate it on a separate period. Making historical charts look cleaner is easy; finding behavior that remains useful on unseen data takes more care.
Position sizing remains a separate decision. The indicator does not calculate a recommended lot size, stop loss or profit target. Its arrows include visual padding, so their plotted coordinates should not be treated as entry or stop prices. Our forex risk-management guide covers the wider planning considerations.
Closed candles help, but context still matters
The confirmed-swing and closed-candle rules avoid provisional intrabar arrows. They should not be turned into an unconditional “never repaints” promise. Corrected broker history, changed inputs or a different calculation window can alter historical output. Older signals also leave the displayed window as new candles arrive.
Confirmation introduces a deliberate delay, and different broker feeds can produce different markings. A chart with no arrows may simply have no pattern that passes all the filters. First check compilation and available history, then inspect the rules before assuming something is broken.
Most importantly, a marked sweep is evidence of a price pattern, not evidence of an established trading edge. The published examples do not supply a verified win rate.
Is Smart Liquidity Hunter worth a look?
For traders who review swing rejection manually, Smart Liquidity Hunter is a sensible tool to explore. The attraction is its combination of visible references, consistent criteria, closed-candle signals and freely available source code. You can see what the indicator is looking for and decide whether that definition matches your approach.
The best starting point is modest: install the correct edition, study several marked and unmarked candles, and build a demo review around the rules. If the markings make your research clearer, the tool has found a useful role in your workflow.
Ready to explore it? Open the full Smart Liquidity Hunter guide for platform examples and input details, then choose the matching download below.
Sources and downloads
- ForexSignal24: Smart Liquidity Hunter guide and settings
- MQL5 Code Base: Smart Liquidity Hunter for MetaTrader 4
- MQL5 Code Base: Smart Liquidity Hunter for MetaTrader 5
Trading involves risk. This article explains a chart-analysis tool for educational purposes; it does not provide a recommendation to enter a trade.
About the Author