Independent educational guide. All numerical examples are hypothetical; this is not a trading signal or investment advice.
A trading platform may show a narrow spread while your account statement tells a less attractive story. That difference does not, by itself, prove a broker is dishonest. Quotes change, market orders cross available liquidity, some providers execute through different venues, and fast news can make the price at submission differ from the price at execution. But without a record of what was quoted and what actually filled, you cannot tell whether an apparently cheap account is economical for your strategy.
An execution audit compares orders against the conditions under which they were sent. It works best when you use a consistent trading journal and collect data rather than relying on a few screenshots from unusually volatile moments. This guide builds a compact method for EUR/USD, shows the mathematics of slippage and demonstrates how a spreadsheet or AI assistant can help spot missing information. No real broker is evaluated or ranked here.
First distinguish the spread from slippage
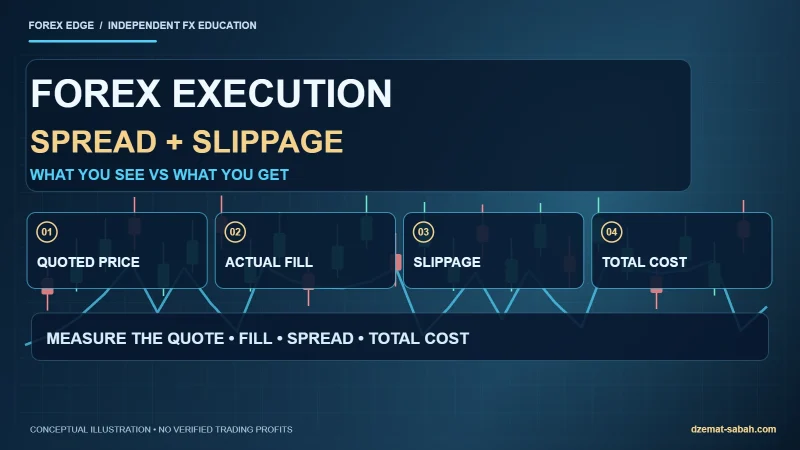
The bid–ask spread is the difference between the broker’s displayed buy and sell quotes at a moment. For a typical EUR/USD quote with a bid of 1.08585 and an ask of 1.08600, the displayed spread is 0.00015, or 1.5 pips. A trader sending a market buy order normally expects execution at or near the available ask, not at the lower bid. Comparing a buy fill with the bid instead of the ask would exaggerate apparent slippage.
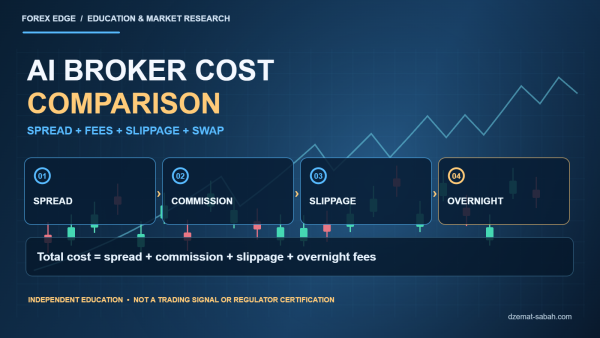
Slippage is the difference between a suitable benchmark execution price and the actual fill. It may be favourable or unfavourable, and it is sensitive to market movements and order type. A stop order may suffer a larger difference when price gaps. Neither spread nor slippage tells the whole story: commissions, financing and currency conversion can add further costs.
Use the correct benchmark for each order
For a market buy, the starting benchmark is normally the prevailing ask available when the order reached the point of execution; for a market sell it is normally the bid. However, a screenshot on a trader’s computer may be older than the server’s price when the order arrived. Network latency, timestamp resolution and broker execution rules complicate the comparison, so do not treat every observed difference as proof of unfair dealing.
Record the local order-send timestamp, platform/server timestamp, requested size and symbol, order type, benchmark bid and ask, returned fill price, commission, and if possible the execution time in milliseconds. Some platforms offer a detailed order history; others may require an export and manual annotation. Always state which benchmark your calculation uses.
A worked example: 0.8 pip of unfavourable slippage
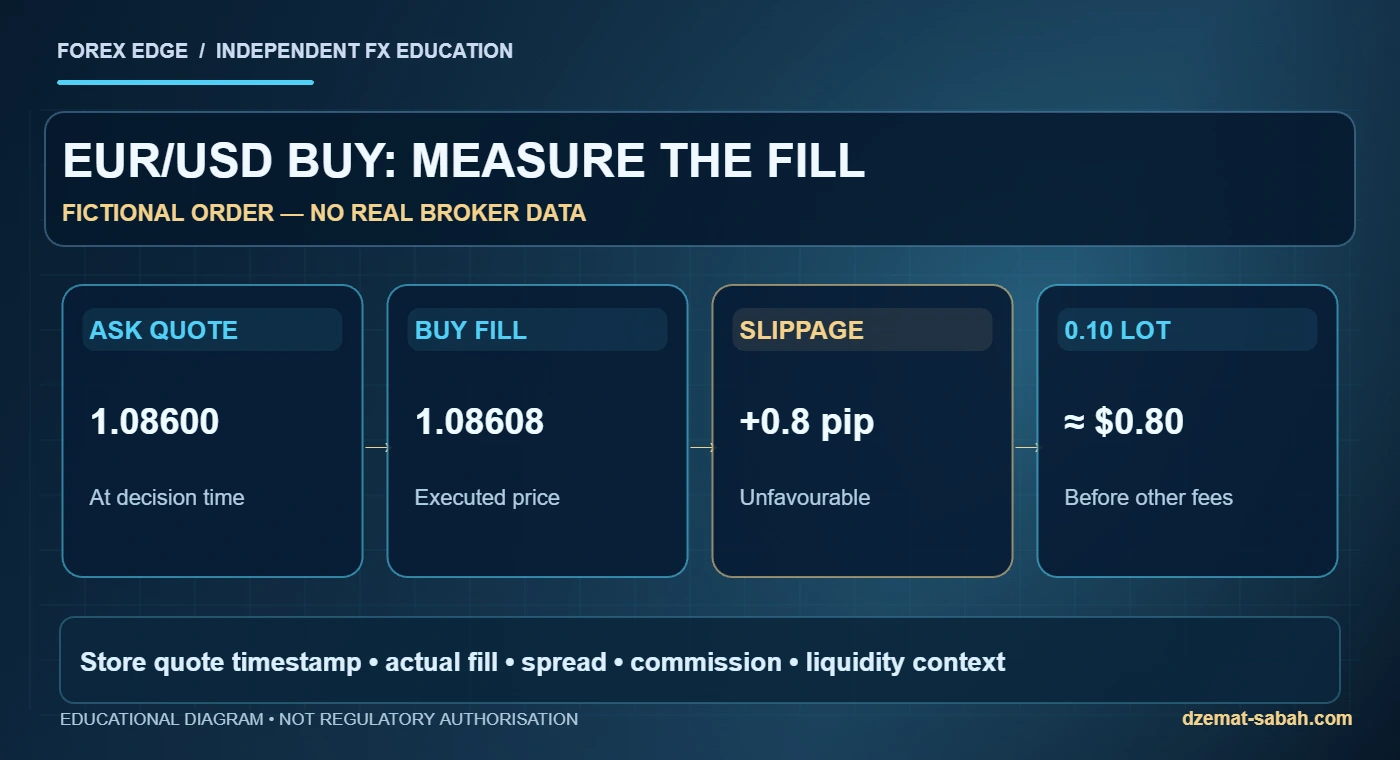
Imagine EUR/USD is quoted at bid 1.08585, ask 1.08600 just before a fictional market buy. The executed buy price is 1.08608. Relative to the ask, the difference is 0.00008, or 0.8 pip of unfavourable slippage. On 0.10 standard lot of EUR/USD in a USD account, a pip is approximately $1, so that difference represents about $0.80 before commission and other charges.
| Measurement | Illustrative value | Meaning |
|---|---|---|
| Displayed bid | 1.08585 | Sell-side quote |
| Displayed ask | 1.08600 | Buy-side quote |
| Ask – bid | 1.5 pips | Displayed spread |
| Actual buy fill | 1.08608 | Execution result |
| Fill – expected ask | +0.8 pip | Unfavourable buy slippage |
| 0.10-lot impact | ≈ $0.80 | Before other charges |
These numbers are invented for teaching. The final result could also differ because the relevant ask changed between the screenshot and server execution. A fair comparison needs a timestamped benchmark and repeatable data capture, not just one attractive or unattractive fill.
Create a useful execution journal
Build one row for each order side. Columns might include: instrument, account type, lot size, server timestamp, order timestamp, direction, order type, bid at submission, ask at submission, requested price if relevant, fill price, commission, realised slippage in pips, spread, news-event flag and session. Separate entry and exit rows so you do not mistake the combined round-trip cost for a single fill.
Add the provider’s published pricing terms and the actual position holding duration. A cost estimate for an order held fifteen minutes should not quietly include an overnight financing charge, and a multi-day trade should not be compared against an intraday model that ignores swap or administration fees. Mark missing values rather than filling them with guesses.
Compare costs across comparable hours
A spread observed during the London–New York overlap should not be compared indiscriminately with a quote at the weekly reopening. Split records by session, order type, lot size and major economic-release windows. Review a distribution rather than only one average: median spread, 90th-percentile spread, typical unfavourable slippage, frequency of price improvements and outliers are all useful descriptive measures.
For instance, a broker that shows excellent median costs but extreme slippage on a subset of stop orders might perform differently for scalpers and for swing traders. That still does not establish dishonest conduct without a proper understanding of the order instructions and the market. Ask whether your sample size is sufficient and whether the order populations actually match before drawing conclusions.
Understand cost in money and in units of risk
If a strategy uses an illustrative 20-pip stop, then a 1.0-pip total dealing cost corresponds to approximately 0.05R, assuming the planned stop remains twenty pips away and pip value is constant. Across 100 trades, a recurring additional cost of 0.6 pip would cost 60 pips of exposure, or around $60 for a 0.10-lot EUR/USD position in a USD account. This is an arithmetic illustration rather than a reported broker cost.
Estimating costs in R makes comparison with strategy expectancy easier, but do not forget that stop-loss fills can differ from the assumed price and that costs may not be constant. If an account has a very short stop and tiny target, spread and slippage may consume a much larger proportion of the planned return than for a longer-horizon trade.
Use AI to find inconsistent or missing records
An AI assistant can help you write spreadsheet formulas, identify implausible timestamps, label outlier fills and present results by hour. Give it the column definitions and a redacted sample, then ask: ‘Check that the benchmark is the ask for buys and the bid for sells; flag any missing quotes, time zone inconsistencies, unaccounted commissions or orders where execution differs materially from the benchmark. Do not invent values or accuse any firm without evidence.’
Recalculate the key rows independently, especially the pip value and conversion to the account currency. A language model can confuse the fifth decimal of EUR/USD with a full pip or apply the wrong sign to a sell. Share no passwords, account credentials or private identifiers. Treat the output as a quality-control list, not a regulatory finding.
How to interpret surprising results fairly
Suppose your journal shows worse fills at 08:30 Eastern Time on US payroll release days. Possible explanations include thinner effective liquidity, changing quotes, latency, the nature of your order type or broker-specific routing. The data suggest further questions; they do not establish the cause alone. Compare like-for-like observations and check the official release time before you identify a pattern.
If the provider publishes an execution policy, compare the policy with observed data. Document cases that materially deviate from your expectation and use the broker’s written complaint channel to request clarification. You may seek information from the competent regulator when appropriate, but always distinguish independently observed facts from inferences and allegations.
A simple weekly review that can improve decisions
Once a week, export your transactions and group them by instrument, session and order type. Compare actual total costs with the assumptions that appeared in your historical backtest. If they are consistently larger, rerun the strategy with the observed costs and a stress scenario rather than assuming the historical return is still achievable. If missing timestamps prevent meaningful analysis, improve the logging process first.
Read the AI broker-cost comparison guide for how different fee schedules work, how forex spreads relate to liquidity, and the realistic AI backtesting guide. The goal of an execution audit is to understand your actual trading costs, not to claim that a cheap-looking order guarantees a profitable strategy.
Frequently asked questions
What is the difference between spread and slippage?
Spread is the difference between buy and sell quotes; slippage compares expected and executed prices for an order using an appropriate side and timestamp.
Does slippage always mean broker manipulation?
No. It can arise from price movement, latency, liquidity and order characteristics. Reliable claims need comparable evidence.
How can I compare execution quality across brokers?
Use consistent instruments, sizes, hours and order types, and calculate all relevant fees and observed fill differences from timestamped data.
Can AI automatically audit a forex account?
AI can assist with data cleaning and calculations when supplied adequate records, but important financial and factual conclusions still require independent verification.
Primary sources and further reading
- CME Group — Introduction to FX
- QuantConnect — Reality Modeling, Fees, Fills and Slippage
- CFTC — Retail forex trading risks
- FCA — Check an Authorised Financial Firm
Markets, execution conditions and financial permissions may change. Review the underlying source and your actual contract before acting. Read our risk disclosure and editorial policy.
About the Author