Support and resistance levels are fundamental concepts in technical analysis, helping traders make informed decisions about market entry and exit points. Support refers to a price level where an asset tends to stop falling due to increased buying interest, while resistance is a level where selling pressure prevents the price from rising further.
Identifying strong support and resistance levels is crucial because these areas represent key decision-making points for traders and institutions. When properly utilized, these levels can significantly enhance a trader’s ability to predict price movements, manage risk, and execute profitable trades.
What Are Support and Resistance Levels?
Definition and Explanation
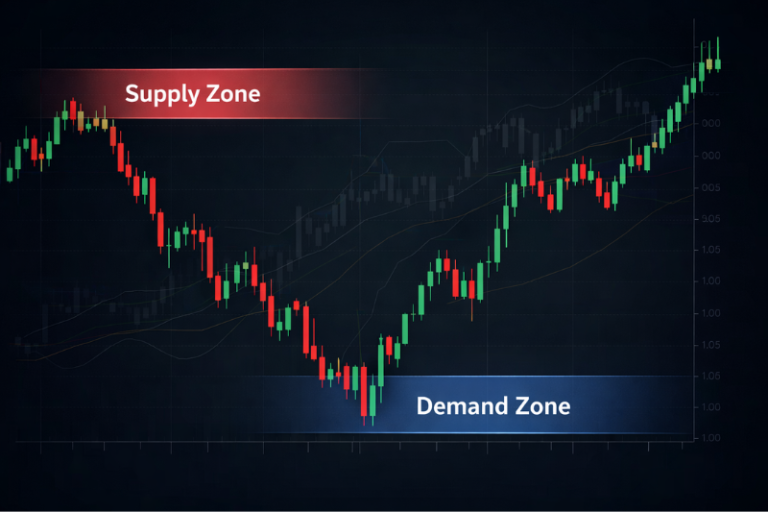
Support and resistance levels act as psychological barriers in the market, where supply and demand forces create potential turning points for price movements.
- Support: A price level where buying interest is strong enough to prevent the price from declining further.
- Resistance: A price level where selling interest is significant enough to prevent the price from rising further.
How Support and Resistance Work
These levels develop due to historical price action, where traders consistently react to certain price points. When the price approaches a support level, buyers tend to step in, and when it nears resistance, sellers often take control. Breakouts occur when price moves decisively beyond these levels, signaling potential trend shifts.
Why Support and Resistance Matter in Trading
Support and resistance levels are essential for:
- Identifying Market Trends: Traders can gauge whether the market is in an uptrend, downtrend, or consolidation phase.
- Determining Entry and Exit Points: These levels help traders decide when to buy, sell, or exit positions.
- Risk Management: Placing stop-loss and take-profit orders based on support and resistance helps manage risk effectively.
- Avoiding False Signals: Understanding these levels can help traders filter out noise and prevent costly mistakes.
Methods to Identify Strong Support and Resistance Levels
Using Historical Price Action
Analyzing past price movements is one of the most reliable ways to spot support and resistance levels. Key swing highs and lows indicate areas where price has reacted strongly in the past.
Trendlines and Channels
- Trendlines: Connecting higher lows in an uptrend or lower highs in a downtrend can reveal dynamic support and resistance levels.
- Channels: Parallel trendlines help traders visualize price movement within a defined range.
Psychological Round Numbers
Round numbers (e.g., 1.2000, 1.3000) often act as psychological support and resistance levels, as traders place orders near these levels.
Moving Averages as Support and Resistance
Moving averages, such as the 50-day and 200-day EMA/SMA, often act as dynamic support and resistance levels that adapt to price movement.
Fibonacci Retracement Levels
Fibonacci levels (23.6%, 38.2%, 50%, 61.8%) help identify potential reversal zones where price is likely to find support or resistance.
Volume Profile & Order Flow
High-volume areas on a volume profile chart indicate strong interest levels where price may react.
How to Confirm the Strength of Support and Resistance
Multiple Touch Points
The more times a level has been tested without breaking, the stronger it becomes.
Volume Analysis
Increased trading volume near a level strengthens its validity, indicating strong market interest.
Confluence with Other Indicators
When multiple technical indicators (e.g., Fibonacci, trendlines, moving averages) align at a specific level, it enhances reliability.
Breakouts and Fakeouts
- True Breakouts: Occur when price closes beyond a key level with strong volume.
- Fakeouts: False breakouts that trap traders; waiting for confirmation helps avoid these traps.
Trading Strategies Using Support and Resistance
Bounce Trading Strategy
Traders buy near support and sell near resistance, assuming price will reverse within the range.
Breakout Trading Strategy
Traders wait for a breakout above resistance or below support, entering trades in the direction of the breakout.
Retest Strategy
After a breakout, traders wait for price to retest the broken level before entering a trade, confirming the new trend.
Stop-Loss and Take-Profit Placement
- Stop-loss: Placed slightly beyond support or resistance to minimize risk.
- Take-profit: Set at the next support/resistance level to secure profits.
Common Mistakes to Avoid When Using Support and Resistance
- Over-reliance on a Single Timeframe: Always analyze multiple timeframes for a broader perspective.
- Ignoring Fundamental News: Economic events can override technical levels, causing unexpected breakouts.
- Not Considering Market Trends: Support and resistance are more effective when aligned with the overall trend.
- Failing to Adjust Levels: Market conditions change, so traders should regularly reassess levels.
Practical Tools to Help Identify Support and Resistance
TradingView & MetaTrader Indicators
These platforms offer built-in support and resistance indicators, helping traders automate analysis.
Automated Support and Resistance Detection Tools
AI-driven tools identify key levels by analyzing historical price data.
Combining Manual and Algorithmic Analysis
Traders can enhance accuracy by integrating manual chart analysis with automated tools.
Conclusion
Spotting strong support and resistance levels is a fundamental skill that improves trade accuracy and risk management. By leveraging historical price action, technical indicators, and trading strategies, traders can gain an edge in the market.
Key Takeaways:
- Support and resistance levels act as key market decision points.
- Multiple methods, including moving averages, Fibonacci, and volume analysis, enhance accuracy.
- Confirmation through volume and confluence with other indicators reduces false signals.
- Avoid common mistakes and use practical tools to refine trading decisions.
By mastering support and resistance levels, traders can navigate the markets with confidence and precision, improving their overall profitability.